
J.G. Donohue and S.N. Sheard, MIM Exploration Pty Ltd
Click here to download paper as PDF
Introduction
Conventional geophysical techniques have been applied in North West Queensland to assist in locating economic mineralisation for some considerable time. The value of large scale airborne surveys such as magnetics, radiometrics and electromagnetics in both mapping and direct detection has been shown in the last decade with such discoveries as Cannington and Osborne (Anderson and Logan, 1992) by targeting discrete magnetic highs (Figure 1).
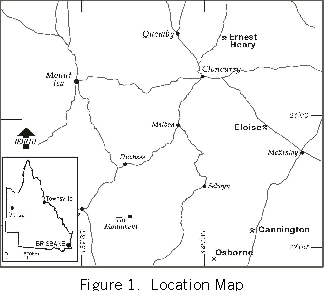 Ground techniques such as electrical geophysics have been responsible for at least two discoveries in the North West Queensland region in the last decade. Both Ernest Henry (Webb and Rowston, 1995) and Eloise (Brechannini and Asten, 1992), were found by drilling time domain electromagnetic anomalies (Figure 1). These ore bodies are situated in the Eastern Succession of the Mount Isa Inlier.
In general terms, apart from these discoveries, the success rate has been rather poor using geophysics in all parts of the Inlier. It should be noted that the success rate using any other exploration tools has also been poor in the last decade.
In the Western Succession the use of electrical geophysics has been conventionally less than the Eastern Succession. This is largely due to the conductive nature of the host rocks which are carbonaceous shales which are electrically conductive and often chargeable (Fallon and Busuttil, 1992). In all regions the oxidised overburden adds another complexity to collecting quality data and also interpreting this data. In general the whole of the Mt Isa Inlier has been a difficult terrain for the application of electrical geophysics.
Recent improvements in acquisition technology both ground and airborne and in processing and interpreting techniques have provided explorers with a renewed interest in using such techniques. These advances include development of new airborne platforms and in-house ground technologies, inversion and visualisation packages for Induced Polarization (IP), Magnetotellurics (MT) and Time Domain Electromagnetic methods (TDEM). In this paper only IP and MT advances will be discussed using examples from North West Queensland.
Advances
Acquisition Systems
The standard ground acquisition systems have not achieved a quantum advance in the last decade. Most surveys adopt standard techniques to collect data such as IP using for example dipole–dipole arrays. These surveys suffer from lack of penetrability and resolution due to effects caused by conductive overburden and the limited specifications of the collecting systems. The results are often good maps of the overburden but not the basement. By adoption of other arrays for example pole–dipole better data could be obtained but geological geometric effects such as steep dips could effect the results. The constraint is largely due to equipment inadequacies which do not allow large array style measurements due to channel limitations and also the resolution of the equipment.
To overcome these problems MIMEX Pty Ltd undertook development of a distributed acquisition system which allowed for unlimited channels measuring data up to 24 bit accuracy – MIMDAS. The system measures all data types including electromagnetics, induced polarisation, controlled source magnetotellurics, magnetotellurics (high and low frequency), and seismic. Currently in excess of 150 channels are operated, but generally only 60 are deployed at once. Measuring many channels simultaneously gives great advantages, including noise minimisation, as time varying noise is common to all channels and can be reviewed.
This high resolution system has been in operation for the last 3 years and has revolutionised the data acquisition approach of MIMEX. Different modes of operation are used but a fairly routine operation is the collection of long lines of data up to 4 kms long using dipole spacing of typically 100m. IP data is collected using a pole–dipole, dipole–pole array. In this array the far electrode is kept in place and the moving current electrode is positioned at a point half way between the potential dipoles. The current electrode is moved up the line 100m and all the measurements are taken again. This array compensates for difficult geometries due to current electrode emplacement and effects very good depth penetration. Figure 2 shows an example of data collected using 100m dipoles to an ‘n’ of 40. This data set indicates the capability of great depth penetration using this method.
At the end of the IP measurement the long line of dipoles are left in place. A series of orthogonal magnetometers are position along the line and a MT measurement is taken. This only takes 15 to 30 minutes extra and gives electromagnetic data which can be interpreted as conductivity depth sections. Thus IP data, DC resistivity and electromagnetic data are obtained in a single survey operation.
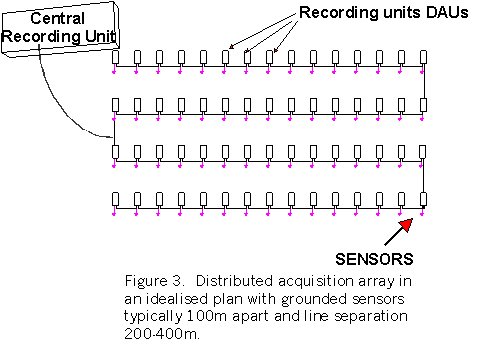
In other applications, data can be collected in array forms as shown in Figure 3. This has the advantage of rapidly collecting a large spatial data set. Obviously savings in logistics are made, but also the data can be used to better resolve geometrically difficult bodies. IP or MT can be collected in a very efficient manner. In the IP mode the many variations of transmitter to receive locations allows selective “illumination” of different geological geometries, and thus better interpretation.
Other advances in ground geophysical techniques are becoming available but these have only been applied sparingly in North-West Queensland exploration programs. An example from 1997 was a test magnetotelluric survey which adopted a technique known as continuous profiling MT. In this mode the contractor EMI collected data on a line of 8 by 100m dipoles with orthogonal dipoles every 400m and magnetic data collected every setup. The line “rolled” along and the data inverted using one dimensional models.
The method, by taking “continuous” measurements, certainly demonstrated that MT had improved dramatically from the previous applications which took spot measurements and attempted to correlate across stations up to kilometres apart. This style of MT is definitely applicable to base metal and gold exploration programs. Some results from this pioneering work will be shown together with a MIMDAS example adopting a similar approach.
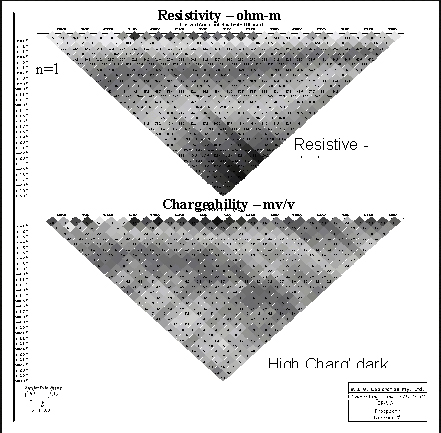
Figure 2. Example of MIMDAS Pseudosections.
Top resistivity and bottom chargeability with a = 100m and n1 to 40, using pole-dipole and dipole-pole array.
Only pole-dipole section plotted.
Interpretation and Visualisation Tools
The advent of affordable powerful computers and the production of two and three dimensional inversion schemes has created tools that allows the explorer to maximise the value of the data. The three dimensional software is still slow and somewhat cumbersome but the two dimensional packages when used wisely create a two dimensional geological image.
This software can be applied to any data sets. In Figure 4 a simple inversion of dipole-dipole IP data over the Ernest Henry deposit using data published by Webb and Rowston, 1995, has been undertaken. The line is centred over the strong TEM anomaly upon which the discovery hole was sited. No IP models were shown in the text. The results show a flat lying conductive overburden in the resistivity model and a discrete chargeable body coincident with mineralisation. A less resistive zone coincident with the chargeable high is probably the manifestation of the conductor noted in the TEM. The authors noted “no indication of a good conductor can be seen in the resistivity section of this location”. Although not a good conductor, a weak feature is evident. Such subtle features being resolved indicates a major advantage of undertaking inversion.
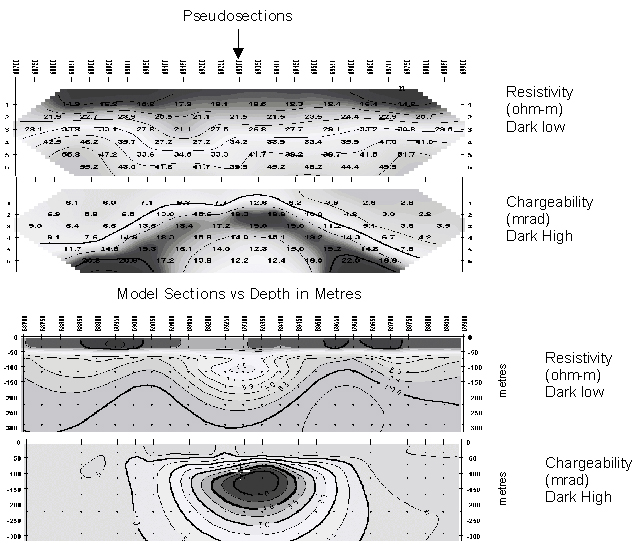 Figure 4. Pseudosections and 2 dimensional model sections, E-W, over the peak of the discovery TEM anomaly shown by arrow. Dipole-dipole 100m, frequency domain, 0.125Hz (after Webb and Rowston, 1995)
The major value of these tools is that geological sections with realistic depth interpretations emerge. When real geological data is known such as depth, or attitude of geology eg. generalised dip, the inversions can be refined using this data / knowledge. As with all of this work the best results are attained when a fully integrated (geology, geochemistry and geophysical) interpretation is performed.
Conclusions
Geophysical applications in North West Queensland have been partially successful in targeting economic mineralised systems. Both the geological and geophysical techniques and application need to be continuously improved to find more.
The region is not very hospitable towards electrical techniques due to the thick electrical conductive overburden. This has proven difficult for conventional techniques. Using advances in geophysical acquisition technologies, visualisation and interpretation techniques these difficulties are diminishing. With persistent application the success rate will certainly improve as integrated geophysical, geochemical and geological interpretations evolve with ever increasing sophisticated well resolved data sets.
References
Anderson, C.G. and Logan, K.J., 1992. The History and Current Status of the Osborne Cu and Au Deposit, Mt Isa. Exploration Geophysics, Vol. 23, Nos. 1 /2:1-8.
Brescianini, R.F., Asten, M.W. and McLean, N., 1992. Geophysical Characteristics of the Eloise Cu – Au Deposit North-West Queensland. Exploration Geophysics, Vol. 23, Nos. 1 /2: 33-42.
Fallon, G.N. and Busuttil, S., 1992. An Appraisal of the Geophysical Effects of the Mt Isa Ore Bodies, Mt Isa. Exploration Geophysics, Vol. 23, Nos. 1 /2:133–140.
Webb, M. and Rowston, P., 1995. The Geophysics of the Ernest Henry Cu-Au Deposit (NW) Qld. Exploration Geophysics, Vol. 26, Nos. 2/3:51–59.
Received: March 2000
Published: Jan 2001
AIG Journal Paper 2001-01, Jan 2001