Greg A. Partington, Ross Mining NL
Level 4, 139 Coronation Drive, Milton Queensland 4064
gapmas@ozemail.com.au
Click here to download paper as PDF
ABSTRACT
It is important that risks of developing mineral resources are known as accurately as possible. This process starts at the pre-discovery exploration stage and should continue through feasibility to the development stage. Until recently, this type of analysis has been carried out manually, leading to intuitive judgements. With GIS and resource estimation software now available on personal computers, probabilistic models can now be generated. A program of digital data compilation has recently been undertaken to allow the use of more probabilistic data analysis techniques, moving away from the traditional expert-system methods. The first prospectivity map was in the Drummond Basin where the aim was to assess the potential of the area and to test current geological models. Prospectivity mapping, using weights of evidence techniques was carried out at approximately 1:100,000 scale. The initial work involved database compilation, which highlighted errors and gaps in the database.
The result of the Drummond Basin study, although useful, was not as important as the analysis. This provided some important lessons and provided a focus on geological models and exploration methodologies. This analysis allowed the comparison of disparate datasets and associations not easily recognisable between these datasets. This work increased the confidence in the exploration models and techniques currently used in the Drummond Basin. The calculation of the prior probabilities produced a correlation matrix of variable comprising the geological model. This allowed an objective assessment of the model and those features that should be concentrated on during exploration. Finally working with GIS datasets has highlighted the need for good quality data and data management. This has become a problem, as databases are presently available from a diverse number of groups, resulting in variable data quality and standards. No matter how sophisticated your analytical software if your data is poor the result will be of a similar quality. This applies to all aspects of the exploration industry from spatial mapping (GIS) to resource modeling.
INTRODUCTION
It is important that risks of developing mineral resources are known as accurately as possible. This process starts at the pre-discovery exploration stage and should continue through feasibility to the development stage. The task of the Exploration Group is to take diverse spatial data-sets at a variety of scales to produce accurate economic estimates of the mineral potential of areas chosen for exploration. Until recently this type of analysis has been carried out manually and on an ad hoc basis (Henley 1997), leading to intuitive judgements being made that have no statistical basis. With GIS and resource estimation software now available on personal computers this task can be automated and consequently these estimations have become considerably more sophisticated (Bonham-Carter 1997; Singer 1995; Knox-Robinson and Robinson 1993), allowing probabilistic models to be generated.
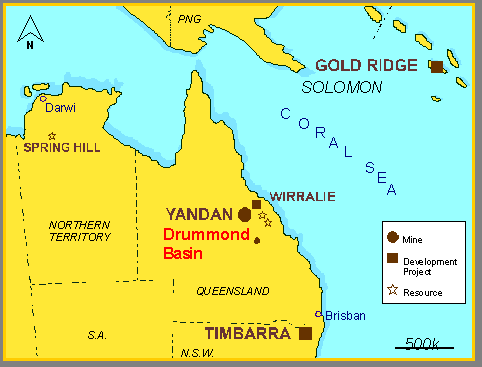
Ross Mining NL has built up an extensive exploration geological database over the last ten years. This represents a significant asset to the company that has taken millions of dollars to compile. A program of digital data compilation has recently been undertaken to allow the use of more probabilistic data analysis techniques, moving away from the traditional expert-system methods. The GIS is the perfect management tool for this. The first prospectivity map (e.g. Bonham-Carter 1997) to be developed was in the Drummond Basin (Figure 1), where digital data mainly compiled from old plans and maps were used. The aim of this analysis was to assess the potential of the area and to test current geological models. The techniques used for the analysis will be described, and the results will be presented, with a general discussion on issues relating to this type of analysis in relation to exploration potential.
Figure 1. Project Location in Relation to the Drummond Basin.
DATABASE AND SOFTWARE
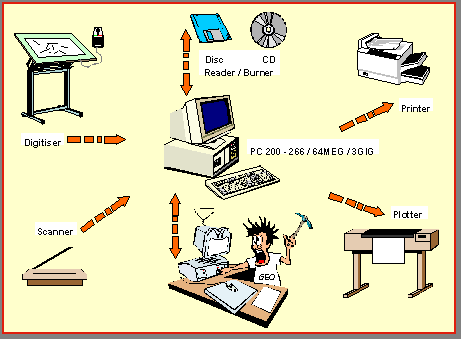
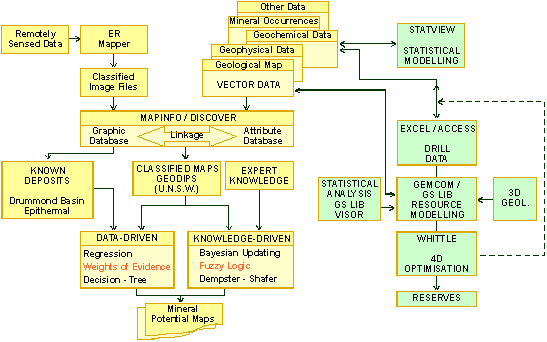
A flow diagram showing typical data capture and management hardware systems used to develop the prospectivity map is shown in Figure 2 and typical database-GIS software relationship are shown on Figure 3. Access was used as the main database. ER Mapper and the Mapinfo GIS software were all used for GIS analysis. Mapinfo in particular was used for geochemical data, geological mapping, cadastral data, and tenement data manipulation. All raster information, such as magnetic data and satellite imagery, were processed through ER Mapper. All packages are easily linked through internal drivers saving time and errors through importing and exporting data. The Discover utility was used in conjunction with Mapinfo for gridding and contouring and basic statistical analysis and graphing.
Figure 2. Exploration Office Hardware Configuration.
Figure 3. Exploration Software System.
PROSPECTIVITY MAPPING IN THE DRUMMOND BASIN
Prospectivity mapping, using weights of evidence techniques (Bonham-Carter 1998), was carried out at a broad regional scale, approximately 1:100,000 scale. The initial work involved database compilation, which highlighted errors and gaps in the database. It also highlighted the need for more detailed geological work to be carried out, and this is in progress.
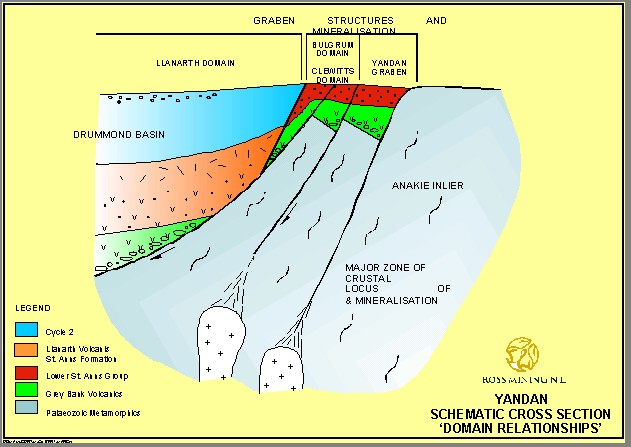
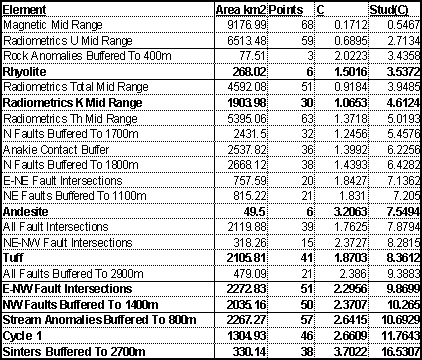
Gold mineralisation in the Drummond Basin is associated with epithermal centres and appears to be lithologically and structurally controlled (Figure 4). The gold mineralisation occurs in a well-defined stratigraphic position, often associated with sinters. The mineralisation is fault controlled and has been found using various geochemical techniques. There appears to be two phases of mineralisation, an earlier phase related to epithermal mineralisation and a later economically less significant phase that overprints the epithermal gold mineralisation related to Carboniferous granite intrusion. These features form a well-defined geological model (Figure 4), which provides a set of variables to be tested by weights of evidence analysis. The elements of this analysis are given in Table 1.
Figure 4. Drummond Basin Epithermal Gold Deposit Model.
Table 1. Drummond Basin Spatial Analysis Weights Of Evidence Results.
Initial work consisted of reviewing, checking data and excluding all prospects that were related to the later mineralisation. Point data and vector data were then converted into raster images using numerical coding in Mapinfo (Table 2). All the datasets were then imported into the University of New South Wales Geodips software package for analysis by weights of evidence and fuzzy logic techniques (Taylor 1998).
Table 2. Drummond Basin Spatial Analysis Coding Geology.
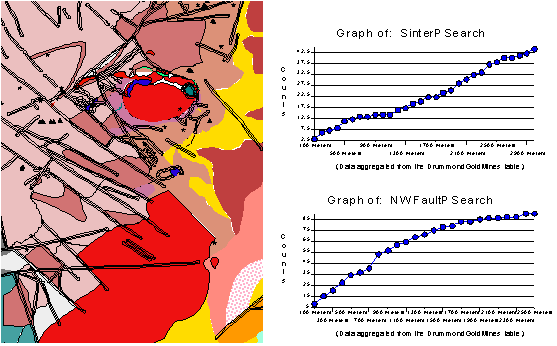
The raster images were converted into binary maps using geodips and buffering of various linear data including fault orientations and intersections carried out (Figure 5). These were then analysed to determine the prior-probability weights of evidence scores using similar techniques as Bonham-Carter 1997. This table was compiled and analysed to highlight statistically the features that correlated best with the epithermal gold prospects (Table 1). The Geodips software was then used to create post-probability weights for those features that appeared to be most important in hosting mineralisation (Table 2).
Figure 5. Drummond Basin Spatial Analysis Of Faults And Sinters In Relation To Epithermal Gold Mineralisation.
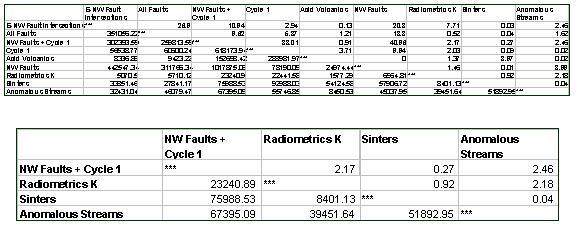
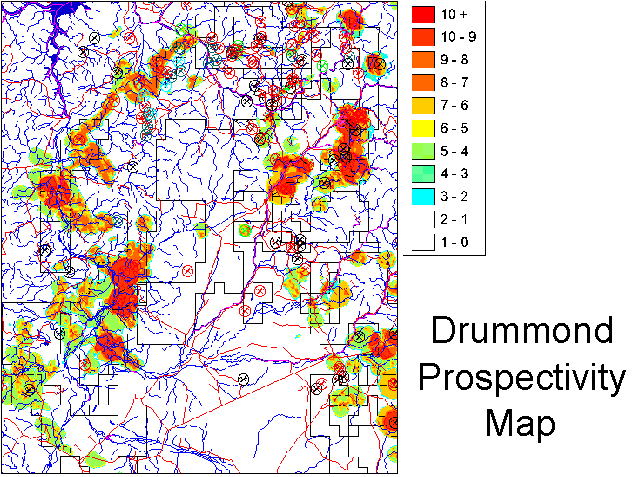
A series of tests were then carried for the assumption of conditional independence (Table 3). It is clear from the current data set that this assumption cannot be met, as is the case for many geological datasets. Several variables were combined to reduce this problem and a final prospectivity map produced again using Geodips (Table 3 and Figure 6). This map was then plotted with the known prospects and compared favourably with the known deposits. Additional prospective areas were also highlighted.
Table 3. Drummond Basin Spatial Analysis Results Of Conditional Independence Test.
PRACTICAL CONSIDERATIONS IN THE USE OF GIS IN EXPLORATION
The end result of the Drummond Basin study, although useful, was not as important as the analysis. This provided some important lessons and provided a focus on geological models and exploration methodologies. This analysis allowed the comparison of disparate datasets and associations not easily recognisable between these datasets. This work increased the confidence in the exploration models and techniques currently used in the Drummond Basin.
The calculation of the prior probabilities produced a correlation matrix of variable comprising the geological model. This allowed an objective assessment of the model and those features that should be concentrated on during exploration. Some interesting and unexpected results were returned. It has always been assumed that fault intersections control mineralisation in the Drummond Basin and that there is some link between north westerly and north easterly structures. The weights of evidence show that faults are important, but north westerly structures are the most important. Fault intersections are less relevant. Rock chip samples give a poor correlation where-as stream sediment sampling gives good correlations. This has allowed an objective assessment on the merits of various geochemical techniques. Finally sinters have the best correlation with mineralisation, confirming the basic geological model. This part of the exercise was most useful as it focused attention on database quality and the exploration models being used.
The poor results from the conditional independence tests suggest that the final prospectivity map is not accurate. However, a comparison of the post probability scores for each prospect (Table 4) has correctly ranked the size and importance of the prospects with known production. Although the result is not accurate in detail it allows a good regional ranking of an areas prospectivity (Figure 6). This has allowed a review of the tenement position in the area and confirmed the importance of areas to be targeted by exploration.
Table 4. Drummond Basin Spatial Analysis Prospectivity Results.
Figure 6. Drummond Basin Spatial Analysis Prospectivity Map.
FUTURE DIRECTIONS FOR GIS ANALYSIS
Future work should include:
- Improving data quality
- Adding to the digital database
- Developing better method for carrying out prospectivity analysis
- Developing systems to allow a smooth transition from spatial data analysis at a regional scale to geostatistical data analysis at a resource development scale.
The intention is to use these techniques to improve estimations of the metal content of areas of the earth’s crust, allowing better decisions with regard to development and risk management.
It is clear that GIS has arrived in terms of the exploration industry. Whether it is used as an intelligent drafting system or at a greater level of sophistication to derive estimates of the potential of areas to host mineralisation will depend on training and available software. Ross Mining is taking the more sophisticated route and has achieved some success in prospectivity mapping. Work is currently focussing on improving geological databases for use in prospectivity mapping. Magnetic data has recently been used at Gold Ridge in the Solomon Islands to produce a three dimensional geological interpretation of the geology around the Gold Ridge Mine. Detailed structural interpretation was then used to create a kinematic history for the region. The time component allows a four dimensional geological map to be produced when compiled in a GIS. This work has successfully highlighted structures present at the time of mineralisation and structures reactivated at the time of mineralisation. This will allow more focused exploration and better defined prospectivity maps. A similar exercise is currently underway in the Drummond Basin. This type of information will greatly enhance the next generation of prospectivity maps produced by the company
Finally working, with GIS datasets has highlighted the need for good quality data and data management. This has become a problem as databases are presently available from a diverse number of groups, resulting in variable data quality and standards. No matter how sophisticated your analytical software if your data is poor the result will be of a similar quality. This applies to all aspects of the exploration industry from spatial mapping (GIS) to resource modeling. Ross Mining is currently spending significant resources addressing this problem. It is clear that data quality standards are required for GIS information if exploration companies are to fully benefit from the current trend to the use of GIS in exploration.
REFERENCES
Bonham-Carter G. F., 1997. Geographic information systems for geoscientists: Modelling with GIS. Pergamon, London.
Knox-Robinson C. and Robinson D.C., 1993. Application of geographic information systems (GIS) to regional-scale gold prospectivity mapping. In Williams, P.R. and Haldane, A.J. eds, An International Conference on Crustal Evolution, Metallogeny and Exploration of the Eastern Goldfields, Extended Abstract Volume. AGSO Record 193/54, pp 211-216,
Henley R. W., 1997. Risky business: The essential blending of financial and scientific skills in the modern resource sector. New Zealand Minerals and Mining Conference Proceedings 1997 29-33.
Singer D. A., 1995. World class base and precious metal deposits: A quantitive analysis. Economic Geology 90, 88-104.
Taylor G., 1998. Geoscience GIS Desktop and prospectivity mapping. Short Course Notes At the UNSW Key Centre For Mines 1998.
Received: October 1999
Published: April 2000
AIG Journal Paper 2000-01, April 2000
Copyright (c) The Australian Institute of Geoscientists, 2000

